21+ Incredible Instagram Stories Stats to Know in 2020
5 Rising Social Media Platforms in 2020
January 19, 2020
Travellers Insurance
January 27, 2020

21+ Incredible Instagram Stories Stats to Know in 2020

Instagram Stories could become the next best way to share on social media, as scrolling through traditional news feeds becomes a thing of the past. Instagram Stories, an online social format of 15-second videos, has a broad audience and makes up almost a third of all the social platforms using a Stories-based format. The question is, are IG Stories a fad? How do they compare to competitor networks with a similar feature? What are the advantages of using IG Stories? We’ve gathered a collection of the essential stats on Instagram Stories to help answer these questions.

Instagram Stories Stats

  • 500 million users now use Instagram Stories every day.
  • 31% of Millennial and 39% of Gen Z users create Instagram content.
  • 86.6% of Instagrammers post on Instagram Stories.
  • 60% of Millennials watch and post Instagram Stories.
  • 1 in 4 Millennials and Gen Z-ers look for Stories of the products or services they want to buy.
  • Brands use Instagram Stories and posts almost equally.
  • 17.8% of Instagrammers watch IGTV.

Instagram Stories Users

1. Instagram has 1 billion monthly active users and 500 million daily users.

When it comes to the number of monthly active users, the top three social media networks are Facebook, YouTube, and Instagram. A Facebook-owned network for sharing photos and videos, Instagram is third only behind Facebook and YouTube, with a billion monthly active users. Moreover, half of Instagram’s monthly active user base uses the platform every day. The question is, how many of those daily active Instagrammers use Insta-Stories?

(Source: We Are Social)

2. 500 million users now use them every day.

The number of daily active users (DAU) currently sits at 500 million. This number has been continuously rising since 2016, when Instagram first launched the Stories format. A year after the initial launch, it already had its first 150 million users. During the final quarter of 2017, the number of Instagram Stories DAUs doubled to reach 300 million. Last year, 400 million people were using Instagram Stories, and as of this year, Insta-Stories has 100 million more daily users.

(Source: Statista)

3. All Facebook-owned platforms with a Stories format have over half a billion daily active users each.

Facebook-owned social media platforms with the Stories format include Instagram, Facebook, Messenger, and WhatsApp Status. Instagram Stories, according to the latest IG Stories stats, counts 500 million DAUs as of January 2019. Facebook and Messenger Stories together reached 300 million daily actives in September last year—and according to the most recent Facebook earnings report, that number has now increased to over half a billion daily users. Status, the WhatsApp Stories feature, also has 500 million DAUs.

Ironically, the pioneer of this format, Snapchat, has 190 million daily actives. As we can see, Facebook is the king of the Stories format. Overall, nearly 1.7 billion accounts use the Stories format daily.

(Source: Tech Crunch)

Usage Statistics

Before we analyze how younger generations use Instagram Stories, let’s see how active Instagrammers are in creating and consuming content across this social media network.

4. 31% of Millennial and 39% of Gen Z users create Instagram content.

The percentage of Instagram users that create content on this social media network is much lower compared to those who consume the network’s content. So we have 31% as content creators among Millennials and 39% among Gen Z. In contrast, these two generations are much more active in consuming Instagram content, with 70% of Gen Z users and 58% of Millennials defining themselves as content consumers.

Now, let’s see if there are any differences in how Instagrammers use Instagram Stories.

(Source: VidMob)

5. 86.6% of Instagrammers post on Instagram Stories.

Not only do Instagram Stories stats like this illustrate a high adoption rate of the Stories format, but it also shows that Instagrammers are quite active in creating Instagram Stories. So while we had roughly one-third of content creators among younger populations on IG, Insta Stories is an exception. Almost everyone uses Instagram’s Stories format.

However, only 36.6% of Instagrammers prefer watching Stories, with 63.4% of users favoring Insta posts. Still, nearly all users post on IG Stories. Considering that one-third of IG users are content creators, content creation trends are clearly more impressive with Stories since 86.6% of its users create content.

(Source: The Preview App)

6. 60% of Millennials watch and post IG Stories.

Instagram Stories stats show that Millennials favor Instagram Stories over other social media Stories formats. According to VidMob’s 2018 “State of Social Video” report, 60% of Millennials use Insta Stories. A somewhat lower percentage of Millennials use Stories on Snapchat (53%). And Facebook ranks third, with 48% of Millennials using the network’s Stories feature.

(Source: VidMob)

7. 59% of Millennials and 70% of Gen Z users watch IG Stories.

It has the largest viewership among Millennials (59%), Instagram Stories usage stats show. However, Snapchat performs slightly better with Gen Z users when it comes to watching Stories. 72% of users from this age group watch Stories on Snapchat, compared to 70% doing so on Instagram.

(Source: VidMob)

8. 61% of Instagrammers use Stories to see what their friends are doing.

A study from Facebook revealed the top three reasons Instagrammers watch Stories. According to stats, the highest percentage of users, at 61%, checks IG Stories to see what their friends are currently doing. 58% of Instagrammers watch Stories to see unedited/authentic content, while the third most common reason behind watching Insta Stories, at 55%, is finding the funny content selected by users.

(Source: Facebook)

9. 1 in 4 Millennials and Gen Z-ers look for Stories of the products or services they want to buy.

IG Stories isn’t just a way to connect with friends and family or find humorous content. Instagram Stories statistics show that the format is also useful for helping Instagrammers make purchasing decisions. A VidMob study showed that 25% of Millennials and Gen Z users browse IG Stories for the products and services they’re considering buying. This stat shows that Instagram Stories is a powerful selling tool that helps businesses do more than just increase their visibility on social media.

(Source: VidMob)

10. 51% of brands are using Video in Instagram stories and it has better retention.

Half of the brands are using video in stories and it is outperforming stories with images by having a tap-forward rate with 5.65% lower. Also, people drop off more on photos than videos.

(Source: Socialinsider)

11. 15–25% of people swipe up on the links in branded Stories.

Stories offers the convenient option of simply swiping up on an Insta Stories link to visit a site. These Instagram swipe-up ads have been warmly welcomed by Instagram users. The following average swipe-through rates come from different brands that have successfully used this feature.

The clothing brand MeUndies saw 15% to 20% of all visitors to their site coming from the link they’d added to their Instagram Story. Outside magazine recorded an even higher swipe-through rate, with 20% to 25% of Instagrammers following the Stories link to visit the magazine’s website.

These findings are, however, from 2016. We can assume that the swipe-up feature today offers different Instagram Stories stats, with the 2019 swipe-through rates most likely being significantly higher.

(Source: Marketing Land)
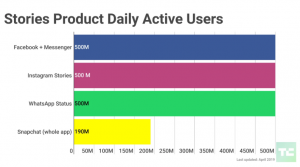
Instagram Stories Compared to Instagram Posts

12. Brands use IG Stories and posts almost equally.

A study by Social Bakers revealed that 46% of Instagram accounts use Stories, while the remaining 54% of accounts leave posts. With the overwhelming popularity of Instagram Stories, we expected the Stories usage to surpass that of posts, but more than 1,100 IG business page owners have spoken. Insta Stories has not yet reached its full potential. Since IG Stories entered the Instagram sphere just three years ago, these stats perfectly illustrate its current adoption stage.

(Stories: Social Bakers)

13. 19% of all impressions are for Stories.

In the battle of Instagram Stories vs posts, Instagram posts get the majority of impressions, i.e., 81% of them. However, despite contributing to only one-fifth of impressions, Instagram Stories increases the volume of impressions. The best way to look at the Stories format is as an additional source of impressions that could potentially boost user engagement.

(Source: Social Bakers)

14. The average posting frequency for IG Stories is 2.3 posts per week.

A common question about Instagram Stories is, how often should you post your Stories? To answer this, we turned to Block Party’s Instagram Stories stats, whose 2018 findings indicate that the average posting frequency for IG Stories is 2.3 posts per week. The consulting agency analyzed 100 leading IG accounts. Apart from the IG Stories posting frequency, they’ve discovered that sports companies and companies from the beauty and cosmetics vertical actively publish around five Stories per week.

Another interesting find from this study is that these Stories should have eight frames, e.g., photos and videos. So how many Instagram Stories should you post? Ideally, two to three eight-frame Stories per week.

(Source: Block Party)

Instagram TV stats

Instagram TV is one of the relatively new features on Instagram, launched in mid-2018. IGTV is a full-screen long-form vertical video that can be up to one hour long. The concept behind IGTV is similar to how YouTube works. Instagrammers create a channel and add their videos to it. The launch of the IGTV could be interpreted as Instagram’s attempt to compete with YouTube. Some even suggest IGTV is a hybrid of YouTube and Snapchat. Instagram’s latest video feature doesn’t support ads for now, but the social media network is highly likely to enable IGTV monetization soon. Now, let’s see how popular IGTV is among Instagrammers.

15. 17.8% of Instagrammers watch IGTV.

The latest IGTV statistics show that Instagrammers haven’t yet adopted IGTV. A mere 17.8% of users watch it, meaning 82.2% of users don’t. It’s too early to say whether it will achieve success with long-form vertical videos, but 2019 should give us further insights into IG’s newest video format, along with more detailed usage statistics.

(Source: The Preview App)

Instagram Story Metrics

Several metrics can help you track how well your Instagram Stories are performing, and you can access them using Instagram Insights. The Insights section lets you explore your Instagram Story engagement rate, view percentages, as well as your content’s reach and impressions. Just keep in mind, you need a business account to access Instagram Insights.

Now, let’s see some Instagram Stories benchmarks.

16. The average reach rate of Instagram Stories is 5.82%.

One of the essential components of IG Stories’ success is the average reach rate, which currently stands at 5.82%. However, various factors can influence the reach rate. The two most important ones are the brand’s industry and the number of followers. So, the sports industry has a reach of 10%, with 781,421 followers on average. The entertainment industry has an average follower count of over a million Instagrammers, but according to IG Stories statistics, the reach rate within the industry is a bit lower, at 6.96%.

(Source: Buffer)

17. The average completion rate for IG Stories is 75%.

The completion rate on Instagram Stories is the percentage you get by dividing the number of people who saw your last Story by the number of people who viewed your first Story and multiply that number by 100.

Buffer analyzed 15,000 Insta Stories and discovered that the average completion rate on Insta Stories has increased by 12% compared to 2017’s findings. The sports industry has once again jumped on top, with an average completion rate of 80%, whereas media has the lowest completion rate at 67%.

(Source: Buffer)

Instagram Stories for Business Owners

Instagram is a powerful tool for businesses. Here are the statistics that back up this claim:
  • About 80% of Instagrammers follow at least one business, and 200 million users visit brand profiles at least once a day.
  • 70% of users now look up a brand on Instagram.
  • 60% of users discover new products through the platform.

These are only three out of the 95 stats we’ve covered in our in-depth collection of Instagram marketing statistics. To see a full list of IG marketing stats, read our95 Instagram Statistics for Social Media Marketing Gurus” guide.

Now, let’s see how businesses use Instagram Stories.

18. One-third of the most viewed are from businesses.

You’ve read it right! This stat not only proves that businesses have accepted the Stories format on Instagram, but that they’re also quite successful with it. Additionally, according to Instagram statistics, 50% of businesses on Instagram create at least one Instagram Story every month. While non-business users may use Insta Stories to express creativity and connect with family and friends, IG businesses leverage Stories to increase engagement rates, conversions, and their overall visibility on social media.

(Source: Instagram)

19. 36% of businesses use them for product promotion.

This is the most common use of Instagram Stories by business owners. Additional Instagram Stories statistics show that the second most common type of Insta Story is an “inside look” (at 22%). This gives Instagrammers a short preview or a teaser of the full content they can find outside of Instagram. 2% of businesses use IG Stories for contests, and 4% of them use this format for fan content. An “influencer takeover” is another popular type of IG Story, with 14% of businesses opting for it. Lastly, life events and how-to Stories are used by 10% and 5% of businesses, respectively.

(Source: Klear)

20. 59% of brands link Instagram Stories to a shoppable page.

Let’s talk about Instagram Stories trends in relation to the pages they typically link to. Most brands (59%) redirect Instagrammers from Stories to a website where they can purchase advertised products or services—i.e., shoppable pages. The second most popular option is to take Instagram users to another social media platform such as Facebook and YouTube, with 23% of brands using this linking practice.

Blog posts (10%) and campaign pages (5%) are the next two linking options. Instagram Stories statistics reveal that its the least common for brands to take Instagrammers on a journey that starts with a Story and ends on an app page (3%), where users can download a relevant app.

If you’d like to know how brands such as IBM, Maybelline New York, and Twitter, among other companies, use IG Stories, this is a must-read:How Businesses Use Instagram Stories.” It includes an infographic featuring 30 IG Stories case studies.

(Source: Klear)

21. The most active industry is fitness.

Instagram Stories statistics from Klear show that the fitness industry has widely accepted Insta Stories, and it’s one of the most active industries on the network. The second most active industry is fashion, followed by retail and then technology. The least active industries on Insta Stories include the food and drink and travel industries.

(Source: Klear)

22. They account for 34% of sponsored content.

This year’s “State of Influencer Marketing” report showed that roughly one-third of advertisers rely on Insta Stories in their marketing strategies. The largest portion of sponsored content goes to Instagram posts (66%). However, according to Instagram’s internal data, 96% of the US marketers surveyed plan to continue using Stories ads in the next six months. So with the massive popularity of IG Stories, we might soon see Instagram advertising trends changing.

(Sources: EMarketer, Instagram)

Leave a Reply

Your email address will not be published. Required fields are marked *